Line Graphs: How to Construct Line Graphs
Free
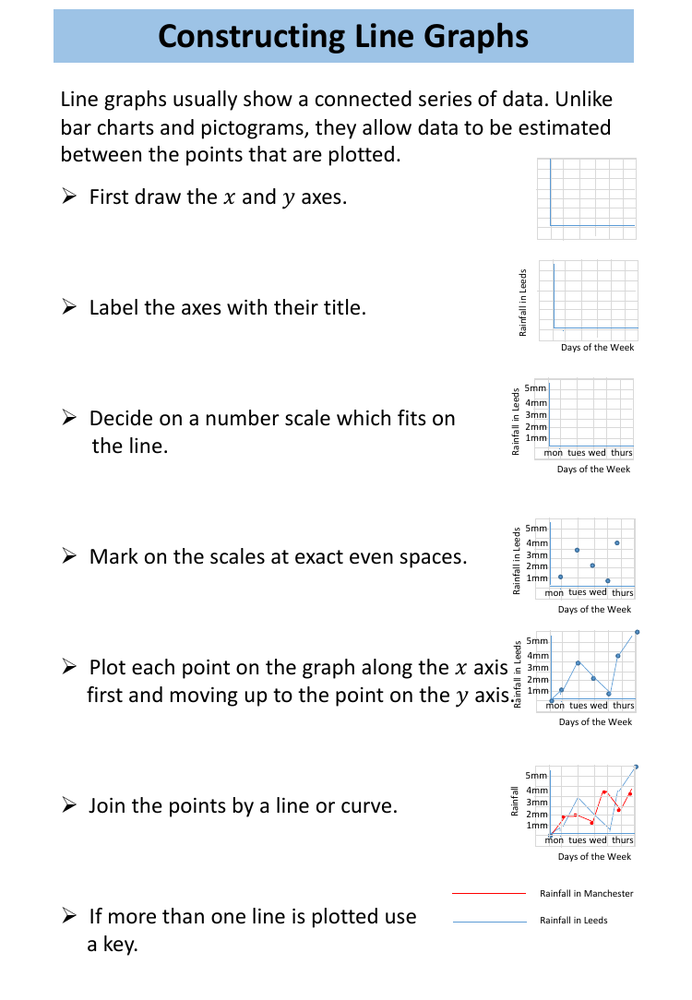
Instruction sheet on how to create line graphs – suitable for Years 4-6.
Additional information
| Resource type | Worksheet/Activity |
|---|---|
| Age range | Age 6-8, Age 9-13 |
Description
Instruction sheet on how to create line graphs – suitable for Years 4-6.
You may also be interested in:
Statistics : Year 4 – Summer Term
This resource contains the first of two packs designed to support the delivery of the White Rose Maths Scheme Year 4 Statistics – Weeks 6-7 of the Summer Term. This resource is for Week 6. The resource focuses on the following White Rose Maths small steps:
Interpret charts
Comparison, sum and difference
The resource contains worksheets / activities (concrete, pictorial and abstract) linked to the above small steps with an emphasis on the mastery approach to learning advocated by the White Rose scheme and includes reasoning and problem-solving tasks. Answer keys and solutions are included.
These resources will develop the pupils ability to achieve the following Year 2 Maths National Curriculum objectives:
Interpret and present discrete and continuous data using appropriate graphical methods, including bar charts and time graphs.
Solve comparison, sum and difference problems using information presented in bar charts, pictograms, tables and other graphs.
Year 4 Statistics Summer Term – Week 7
Save money and buy both packs in a bundle for just £6:


